
USE ADX TO CONFIRM BREAKOUTS
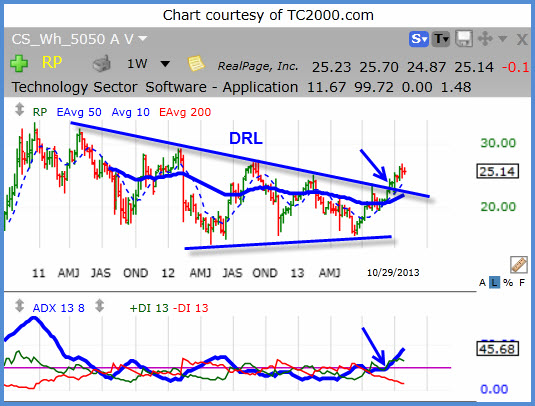
Buying breakouts can be frustrating when price appears to breakout, but fails, trapping the longs and creating a negative gain. With the ADX indicator, the trader can measure the strength of the breakout and improve the probability of success in the trade.
ADX is a trend strength indicator (blue line in bottom window) and is normally used in trending markets. But ADX is also useful for breakouts. When ADX rises above the 25 level (magenta line), price strength is strong enough to trend.
In the example of RealPage (RP) above, price formed a weekly consolidation pattern for over 2 years. A descending resistance line (DRL) can be drawn on the pivot highs of the pattern. The line represents the area where sellers step in to push price down. When price breaks through the line, it means the buying has overcome the selling.
Notice how price broke through the DRL in late September. At that time, ADX rose above the 25 level and continued rising. It is now at 45 which is strong. The ADX is currently above the level of all other ADX peaks in the pattern, except for the +ADX peak that occurred before price entered consolidation. This is another way to see "new" strength (buying) coming into the stock.